Banner generated by claude
TL;DR: I forgot to clean the cooling fans inside my old MacBook Pro and a new monitor is where I noticed the throttling. The fans speed didn’t sound like act-ci or fine tuning Qwen. After the cleaning the fans sat at 1850/1686 and the CPU speed limit stayed at 100.
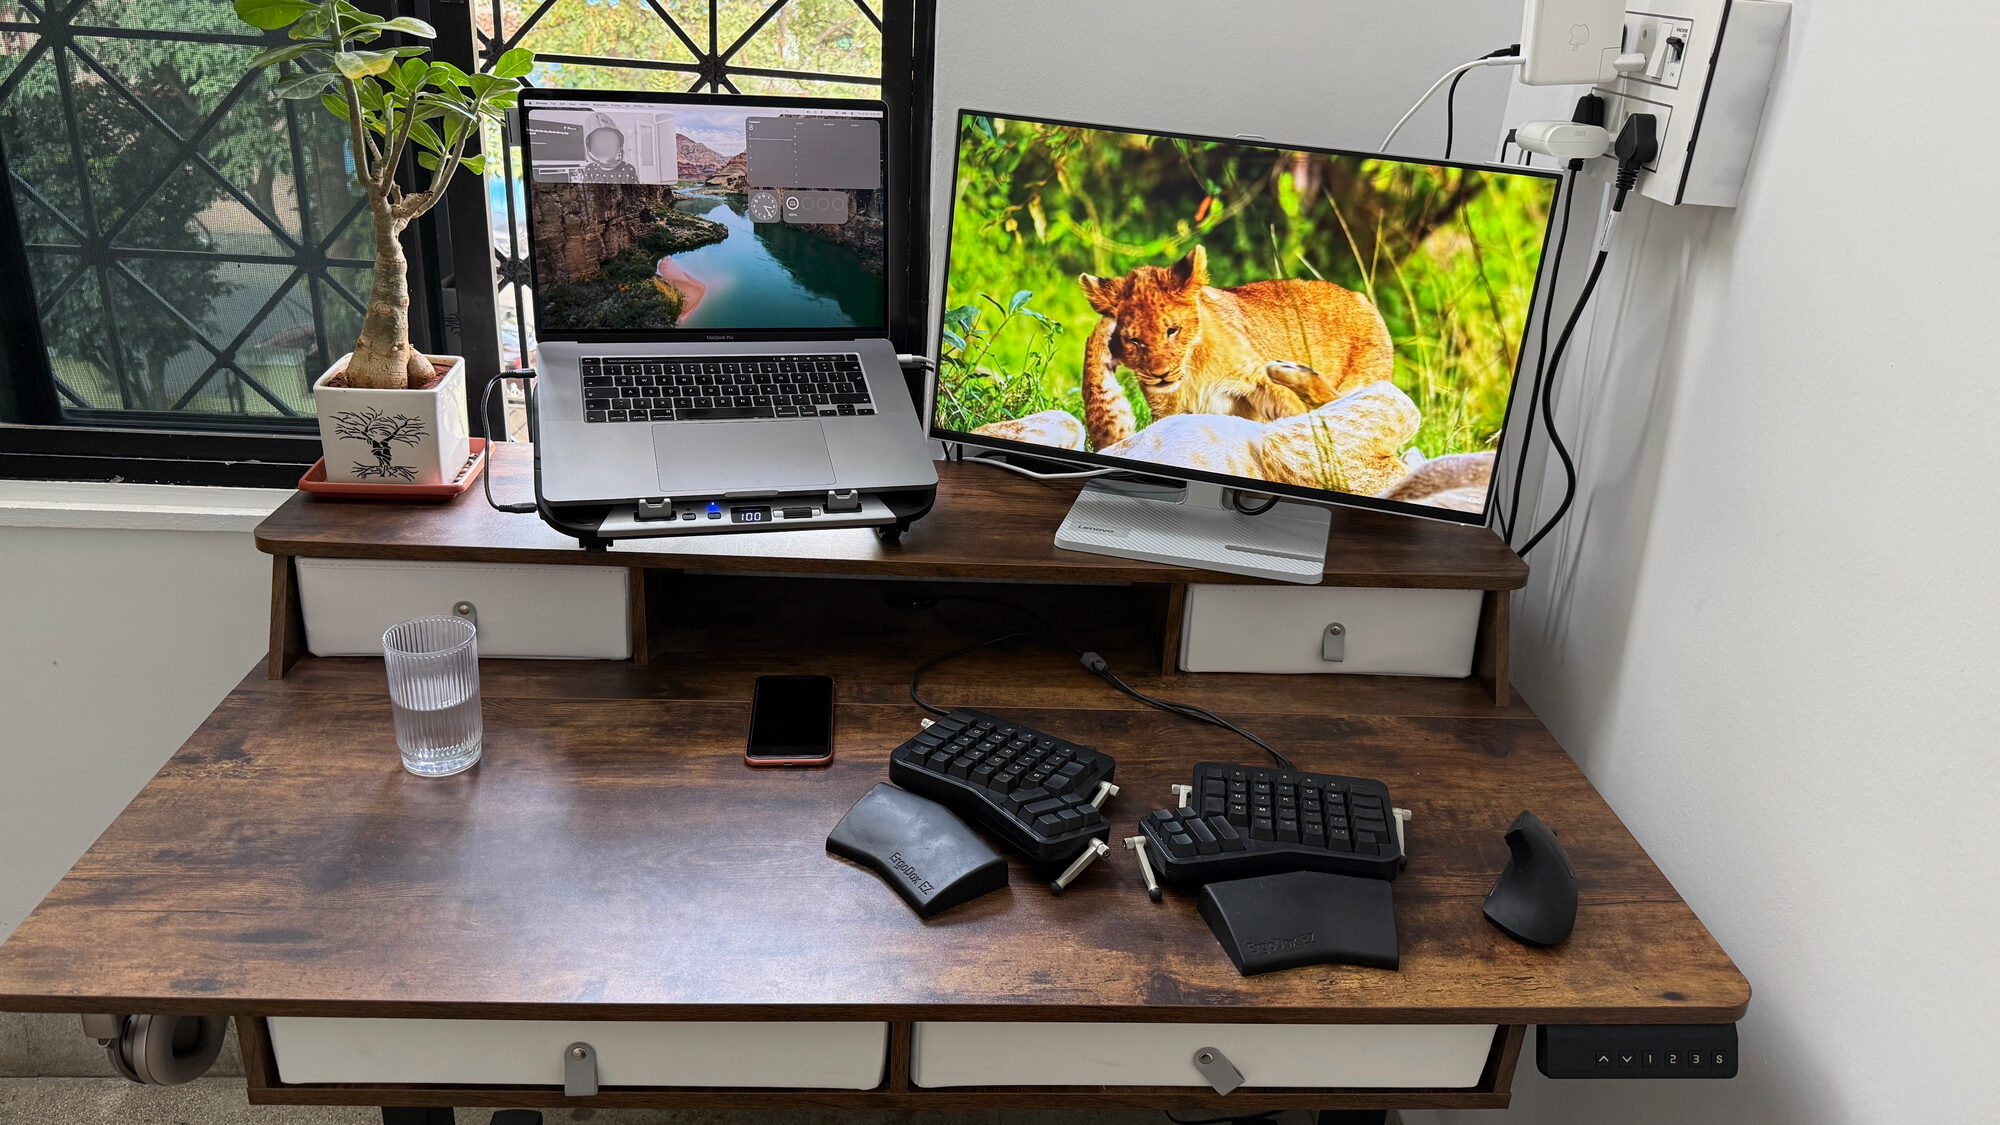
- 2026-10-07, ~19:00: got new external monitor that connects via HDMI as well as USB-C.
- ~19:07: finished setting it up and cables.
- ~19:15: Observed mouse felt sluggish so immediately thought new monitor is causing some issue. Started troubleshooting. Played videos. Closed everything. What I observed was I have new external monitor, moving mouse feels sluggish and video in chrome is playing like stopmotion.
- 19:31: After 15 minutes not able to figure out what was wrong asked claude.
- 19:34:
topsample WindowServer 72% CPU, a Chrome renderer 84%, VTDecoderXPCService 12%, load average 2.7 / 10.3 / 10.9. Nothing pegged, nothing obvious. - 19:47: Multiple changes like forced GPU for external monitor, battery settings, a restart was suggested. Also one
pmset -g loghad a lineThermalEvent Ignored DarkWake thermal emergency signal. claude didn’t stressed on it and I overlooked. - ~20:00: Restarted laptop and sluggishness went away. Closed for the day.
At 19:31 the speed limit read 100, so no throttle showed in anything I sampled and I couldn’t name a culprit.
Next day when I connected external display it was all good for first 5-10 minutes then it started again with sluggishness, mouse movements were lagging by multiple of seconds. Importantly I was running headless Linux VM so my suspicions were on both monitor and VM both could be problematic CPU or GPU. So I started trouble shooting again.
- 10:48 The issue was gone on restart yesterday but back since last 1 hour
- 10:50 baseline, monitor out: the Radeon was driving the built-in panel with nothing attached.
- 10:51 monitor in, through the Satechi USB-C hub on the right side.
- 10:52 the CPU speed limit started falling.
- 10:56 it was at 20.
- 11:12 but why only on monitor? I thought the external ports are wired to the Radeon and the Radeon shares the i9’s heat pipes. Suspect one, the GPU. Wrong.
Monitor out: the VM ran fast. So yesterdays restart was false pretense as I only tested after restart for less than 5 minutes.
VM out, monitor in: Couple of minutes later still sluggishness but was better than with VM and Monitor. So I suspected monitor cable and asked claude to check power delivery with it, which was fine. To try out I used a HDMI cable instead of USB-C and plugged in my charger.
- 11:23 Apple brick (96W) in on the left. The Satechi on the right carried the monitor, the Trust mouse receiver and the ErgoDox EZ.
- The Mac stayed on
75W pd charger, AdapterID 0: the monitor’s USB-C power delivery passing back through the Satechi into the right port. macOS takes the bigger offer and the brick was only offering 60W. - 11:32 monitor out: the brick showed up at 60W and the speed limit was back to 100 by 11:35.
- 11:35 it’s not 96w? A 96W brick on a cable without an e-marker chip negotiates 20V × 3A = 60W, did I bought fake cable last year. Wrong again.
I had 60W cable with 96W charger!!!
I bought USB-C to USB-C cables a year ago both for my wife and myself, somehow mine got swapped with her mine was 240W hers 60W. Always look for certification or e-markers before buying cables.
How did I found out the claude logs showed 60W and I somehow caught on it.
- 11:36 it’s definitely cable let me try different one.
- 11:37 a different cable: 94W within seconds.
This was the problem. Wrong again, but yes it was an another issue which got fixed along.
Through out the year or whenever it got switched my laptop was running on capped supply-in.
This could explain a trip point a little but I “speculate” that my macbook (MacBook Pro 2019 16" i9 AMD Radeon Pro 5500M 8GB) doesn’t throttles performance on low power-in even though CPU needs 45W and GPU 50W as per nominal ratings from google, I think the battery gets compensated which I recall happening but it was when I had ML work on macbook which was almost too heavy for it. Also the monitor USB-C PD was 75W so somehow it made sense. What SMC measure that day below in Data.
To rule out if the issue was with power I tried multiple variations of 96W power brick on different ports, removing external keyboard, mouse, reducing display. But the moment monitor gets plugged in within 5 minutes throttling starts.
I had external monitor use before, extensively last year but since the move (from NL to IN) I didn’t had it. Back to claude to figure out if any particular process is triggered when monitor connects.
So the problem is monitor I thought or this device’s capacity to work with this monitor cause I had different monitor before but it never had this issue. The monitor in question is Lenovo L24D-4C.
Tried monitor connecting via the USB-C hub, used HDMI cable on hub instead of monitor USB-C, suspected maybe that’s the problem.
SMC reset was one of the other suggestions by claude and online. After reset the boot was fast and felt laptop being more response in login screen.
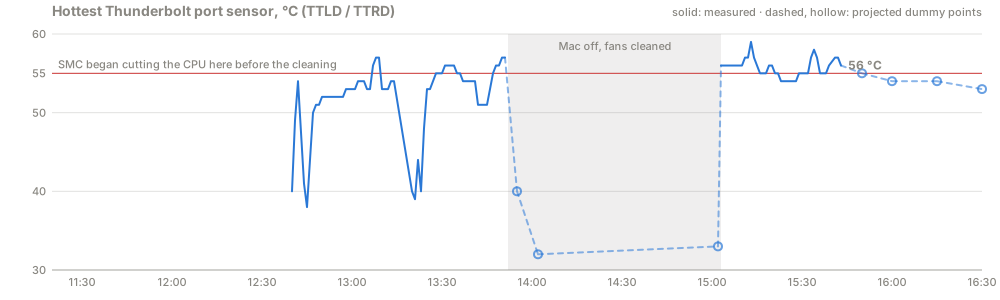
After it the Radeon slept with no monitor and the trip point moved 2 degrees. It moved to 55 °C after the reset then 56 after a short time. This jump meant temperature trip wasn’t statically linked to the load. This was the biggest clue but not what I did but how I did it.
Tried left side ports, tried right side ports. I got suspected of sides also, thought maybe they have aged. While googling found out there are TTLD and TTRD that also contribute to CPU throttling. This was the clue but I just glanced over it and CPU throttling wasn’t in my head cause the fans weren’t spinning that fast for my ears and everything run as good without monitor.
Some data that claude dug up, with my trials.
| on the port | port controller °C | speed limit |
|---|---|---|
| nothing | 38 to 40 | 100 |
| 96W brick only | 38 to 40 | 100 |
| hub + keyboard | 50 to 53 | 100, dips at 54 |
| hub + keyboard + mouse | 53 | 100 |
| monitor direct, USB-C | 53 in 20 s, 57 in 2 min | 38 and falling |
| hub + monitor, either side | 54 to 56 | 20 |
The problem was very clear my macbook doesn’t like my new monitor cause without it it runs fine. Prime suspect Monitor. Wrong again.
I asked does changing extended display to mirror do any difference? No, the link to the monitor runs at the same rate.
From Monitor cable, power cord, USB hub, left and right side ports, every time I thought this must be the problem. I spend lot of time with the hub cause that felt more possibility, but it was innocent.
Nothing was coming up and after purchasing monitor for ₹15000 and not able to use it I felt bad. There’s no way I can connect this monitor to this device at the moment. I can’t return it cause it works fine and can’t use it with the device I have.
Thought of running apple diagnostics, never done it so wasn’t keen on it. Claude suggested “fans not spinning up” as a candidate, then read the fans pinned at maximum with cool chips as a sensor fault, so cleaning them never made my list.
Finally realised my own post
it was still not engineering, just monkey wrenching at best
So I asked claude to write a script for monitoring:
It added per tick, every 5 seconds the scripts reads below and averages them over the window:
- Fans. Every F
Ac key against its F Mn and F Mx, reduced to the fan count, mean rpm, mean maximum and mean use as a fraction of the minimum-to-maximum range. First and last rpm are kept for the COOLING trend. - CPU temperature. The hottest key starting TC, Tp or Te, under 120 C.
- GPU temperature. The hottest TG or Tg key.
- Thunderbolt ports. The hottest TT key for the verdict, plus TTLD and TTRD on their own for the left and right readings.
- Ambient. The hottest TA key, air inside the case.
- CPU speed limit. CPU_Speed_Limit from pmset -g therm, 100 when nothing is wrong.
- CPU idle %. One top reading at the start only, to warn when a load would make the fan reading meaningless.
The SMC runs the fans and sets the speed limit.
powermetrics needs root and shows only die temperatures and fans.
Claude wrote scripts/smcdump.c, 90 lines against IOKit, no root, prints every SMC key.
The improved script is has all above for cooling trends, initial versions didn’t had everything. I think this data collected is common with all macbooks at least macbook pros.
Also asked to write a script that traces which GPU drives which display cause and I kept moving my mouse in the measurements cause with mouse movements it got worse. Not interesting script or output so scrapped the approach.
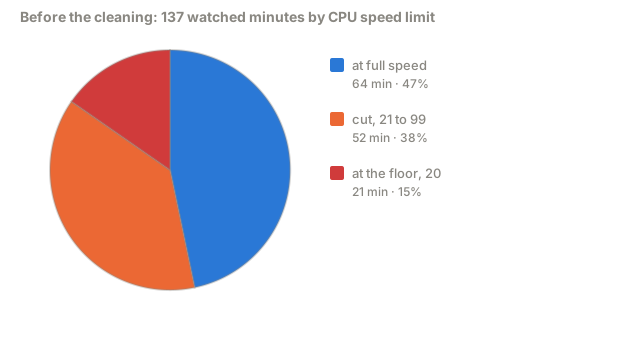
One interesting insight found, A CPU at speed limit 20 runs every core at a fifth of its clock. That’s why top never showed a culprit: the VM at “50%” was 50% of a crippled chip/ 50% of 2 cores that I assigned it not all.
Second thing recovery after unplugging monitor speed limit back to 100 in under three minutes, every time, multiple times.
I collected the data and plotted add at bottom not here cause it makes rest of the story not that interesting.
Asked claude for suggestions, it came back with “Turn on the AC, a desk fan at the ports or a cooling pad and said elevation gave one degree while moving air gives more”.
I had cooling pad “EvoFox Blizzard 2 Xtreme” it has Peltier plates but the effect is almost negligible, don’t have data to prove but don’t buy it. I bought in a desperation similar to this few months ago when I had ML workload on macbook and CPU throttling was eminent. It’s still useful as laptop stand and minor temperature drop to make you feel better.
But then the biggest clue hit me when I realised the problem is combined with CPU and GPU and the common thing between them is heat pipes. I realised before SMC reset I kept laptop shutdown also in morning the sluggishness didn’t arrive within 5 minutes, which meant cooling was the problem even though there was no roaring sound of fans. The reason the biggest clue was clear cause when GPU heats up it shares the heat with the CPU and it then buckles.
I don’t think F0Mx 5616 and F1Mx 5200 rpms reported by claude from SMC is the same thing my ears hear when it’s cooling aggressively. In cases like multiple docker containers running act-ci or if you’re fine tuning qwen I know what it sounds like.
Maybe need to write a script to get actual numbers matching my ears so that I can monitor fans every now and then as I suspect dust and lint clogs the fans and their performance in terms noise improves.
To be honest what I wrote above wasn’t that articulated in my head when I reach for my toolkit. I just had hunch that it was time to clean up the fans.
-
~14:45 I cleaned the cooling fan and general area. It had as suspected and right this time dust, lint and clogs, I cleaned it but still had little thought in my mind is this it? After all I was wrong whole day with wrong suspects.
-
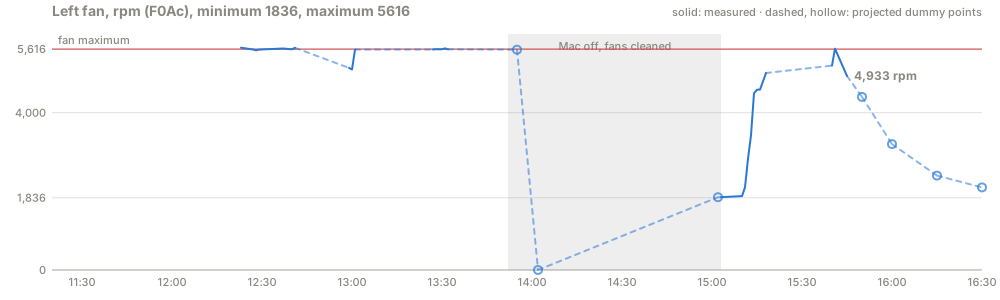
15:03 Six minutes after boot: fans at 1850 / 1686 rpm, their minimum. Thermal levels
machdep.xcpm.cpu_thermal_level36 /machdep.xcpm.gpu_thermal_level0 instead of 100 / 50, Radeon off, built-in panel on the Intel GPU. -
15:05 brick and cooling pad on the left. Left port 56 and speed 100, a sure throttle an hour before.
-
15:10 a different hub, Apple original with 1 Usb, 1 usb-c and 1 hdmi port, the Digital AV Multiport adapter, on the right with monitor, keyboard and mouse. Right port 35 to 50 in a minute, 55 at 15:13, left 59. Speed 100.
-
15:15 keyboard wasn’t working with apple adapter usb-c port: that port is power-in only, so the brick went there, 91W through the adapter. Charging and video through one port, the worst setup of the morning. Speed 100.
-
15:17 gonna play some videos on chrome cause thats where it started.
-
15:20 the monitor was at 144 Hz over HDMI; over USB-C in the morning it had run at 60. 15:22 set to 60 Hz: port 55 to 54.
-
15:33
vagrant up, Chrome video still playing: port 58, the highest of the day, speed 100 for the whole run. -
15:38 “looks like cleaning cpu fans and ports helped a lot, there was lot of dust and cotton like clogs.”
-
15:45 fan-check under that load: fans 5197 / 4803, 89% of range, CPU 89 °C, GPU 78, ports 55 / 58, speed limit 100, verdict OK.
Claude and I under weighted the fans-at-maximum reading all day; at the end Claude had the thermal pads under the port controllers ahead of the fans in its list and that was wrong.
The boot up after clean was surprisingly faster or rather like it was a year ago, funny how when you’re busy in lot of other things you forget how silly things like this feel. But conclusive proof that cleaning already arrived before I opened chrome or terminal, the login screen completed the loading bar at least 5-10 seconds faster.
Again the fan noise should be numbers respective to ears also.
Nearly every SMC reading before the cleaning had both fans at 5616 and 5200 rpm in auto mode so the SMC itself had them there, even at idle. After the cleaning they sat at their 1850 / 1686 rpm minimum.
I think my problem was I never quantified fan speeds or recorded it, whatever reading I got in first SMC dump was kind of useless to me cause I didn’t had baseline to measure it against. But now I do and I’ll do this every 6 months which should be enough time to all the dust and lint in world to find me.
More than dozen of times I have done CPU cooling fan cleaning of laptops and macbooks, for myself, family members and relatives. But this year I forgot or rather I never noticed my macbook’s fan noise cause I was running so many heavy GPU intensive loads on it that it became norm.
I have this device with me for last 7 years now! I still don’t use the touchbar and would like Fn keys, But the service and joy I could get out of it was little overpriced but if it survives another 5 years then it’s “Paisa Vasool”.
Data Link to heading
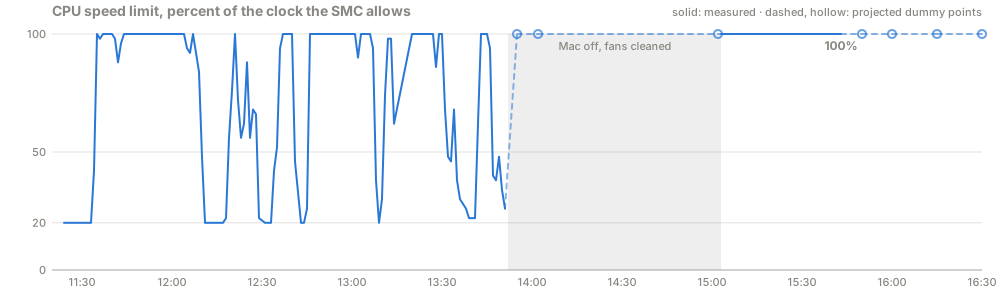
11:32monitor out11:3796W brick on a 5A cable11:58monitor on the 60W cable, no picture12:04monitor on, HDMI via the Satechi hub12:18monitor out12:25First dump, monitor out, VM running, speed limit 88- both fans at their maximum: F0Ac 5651 rpm (target and maximum 5616), F1Ac 5175 (5200). In auto mode, F0Md = 0, so the SMC itself had them there.
- hottest sensor on the board: CPU die 72 °C. GPU 65. Heatsink 58. Battery 36. Thunderbolt ports TTLD/TTRD 40 and 38. Ambient inside the case 28.
- CPU rail 36W with the CPU 80% idle.
- Three “skin” estimate keys, Ts0S/Ts1S/Ts2S, sat at 45.05, 45.05 and 44.5.
12:29monitor on12:33monitor out12:37speed limit back to 100, second and third dumps- A diff of the throttled dump (12:30, monitor in, speed limit 20 to 22) against the recovered one (12:37) found the sensor that tracked the monitor: TTRD, the right-side Thunderbolt controller, 56.1 °C throttled, 37.9 recovered. TaRC, the right-side ambient, 48.8 vs 38.9. The GPU die (TGDD) 72 vs 61. The left port unchanged near 40.
12:41hub moved to the left side12:46hub with keyboard only13:0066W with vagrant up13:06monitor direct, USB-C13:15SMC reset13:24monitor direct13:28CPU 103W in the post-boot burst.13:33vagrant up13:45HDMI via the hub13:52Mac shut down, fans cleaned15:03Mac back on15:10monitor, keyboard and mouse on the Apple adapter15:15brick moved to the Apple adapter15:22monitor at 60 Hz15:33vagrant up
fan-check.sh, smcdump.c and display-trace.sh on GitHub Gist
How the fan-check.sh works now, thirty seconds at idle is the cleanest run, sample below is loaded run from 15:45.
$ scripts/fan-check.sh
fans      2 fan(s), mean 5197 rpm, 89% of the way to maximum 5616
chips     CPU 89 C   GPU 78 C   ambient 28 C
ports     hottest Thunderbolt controller 58 C
speed     CPU_Speed_Limit 100
verdict   OK: fans tracking the load, speed limit 100.
A verdict you should look out for
verdict DUST: fans at maximum with cool chips. Air is not moving through the fins; clean the fans.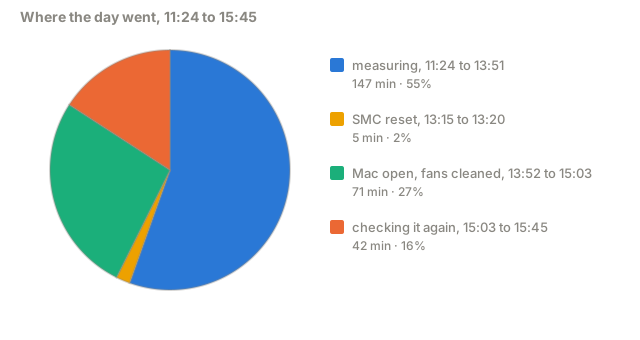
Finally I can enjoy my new monitor now Link to heading